SEED Viewer Manual/KEGG
Kegg Maps
This page allows you to view KEGG maps and statistics for chosen organisms in the SEED.
Usually, you enter this page from a page that had an organism defined. The chosen organism is stated in the header:
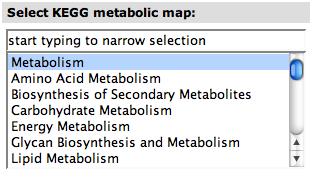
Entering the page, you will see the overview KEGG map pre-selected, which is Metabolism. In the following Filter Select you can select another map. Press select to display the map in the graphic on the bottom of the page.
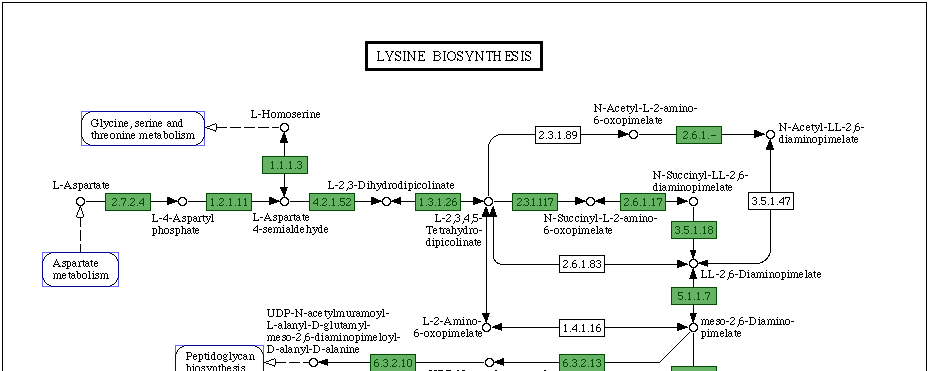
In the example, the KEGG map Lysine Biosynthesis was selected. The map shows the connections between the enzymes and the educts / products of the reactions the enzymes perform.
The enzyme numbers (EC-Numbers) are connected to features in SEED organisms through the functional role assignments to the features. The map is colored for the chosen organism (in this case Escherichia coli K12). If the organism implements a functional role with the EC-number in the map, its box is colored in green, else white.
The blue boxes in the map link to neighboring (connected) maps in the metabolism.
You can view statistics for up to four additional organisms compared to the chosen organism. Select these organisms in the List Select top right on the page. Choose an organism and press the right arrow to select it. For unselecting it, choose it in the right box and press the left arrow. After making your selection, press the select button on the left (same button as above).
The statistics table will show all connecting maps of the selected category for your organisms. For each map, you can see the number of implemented EC-numbers in each organism, as well as the percent of total EC-numbers that are implemented as a green bar. The number links to the connecting map for the organism.


